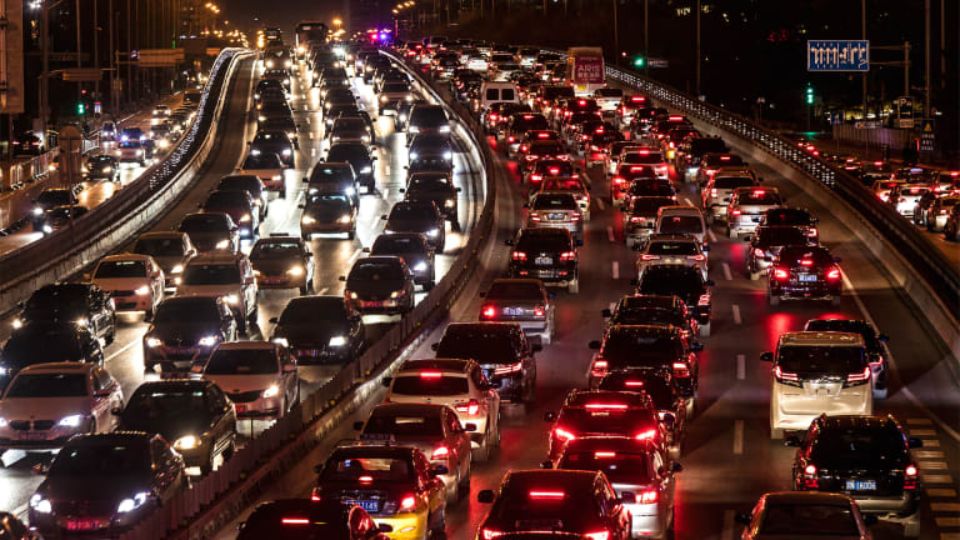
In 2022, traffic congestion got worse in many of the world’s most congested cities. This comes after a decrease in traffic due to the pandemic in 2020. According to a report by INRIX, a company that studies global movement, some cities had more traffic congestion in 2022 than they did in 2019.
The report analyzed commute times during busy and quiet times using GPS data that had been made anonymous. The data was collected from 50 countries and over 1,000 cities over a period of 11 months. In 2022, drivers in major cities in the United States, which had half of the world’s top 10 most congested cities, spent 51 hours in traffic. This was an increase of 15 hours compared to 2021. In comparison, drivers in the United Kingdom spent an average of 80 hours in traffic.
However, traffic is not just a minor inconvenience. It comes with a price – in terms of fuel and “lost time,” a calculated financial cost determined by INRIX. In the United States alone, traffic caused the nation to lose $81 billion, which is equivalent to $869 per driver.
Cities With the Worst Traffic in the World
Chicago, United States
- Hours Lost in Congestion (Average) in 2022: 155
- Change from 2021: +49%
Boston, United States
- Hours Lost in Congestion (Average) in 2022: 134
- Change from 2021: +72%
New York City, United States
- Hours Lost in Congestion (Average) in 2022: 117
- Change from 2021: +15%
Philadelphia, United States
- Hours Lost in Congestion (Average) in 2022: 114
- Change from 2021: +27%
Miami, United States
- Hours Lost in Congestion (Average) in 2022: 105
- Change from 2021: +59%
Also Read: Unveiling The Most Worst Neighborhood In Shreveport for 2024
Conclusion
In 2022, traffic congestion worsened in many congested cities, despite a decrease in 2020 due to the pandemic. A report by INRIX found that drivers in major US cities spent 51 hours in traffic, an increase of 15 hours from 2021.


Leave a Reply