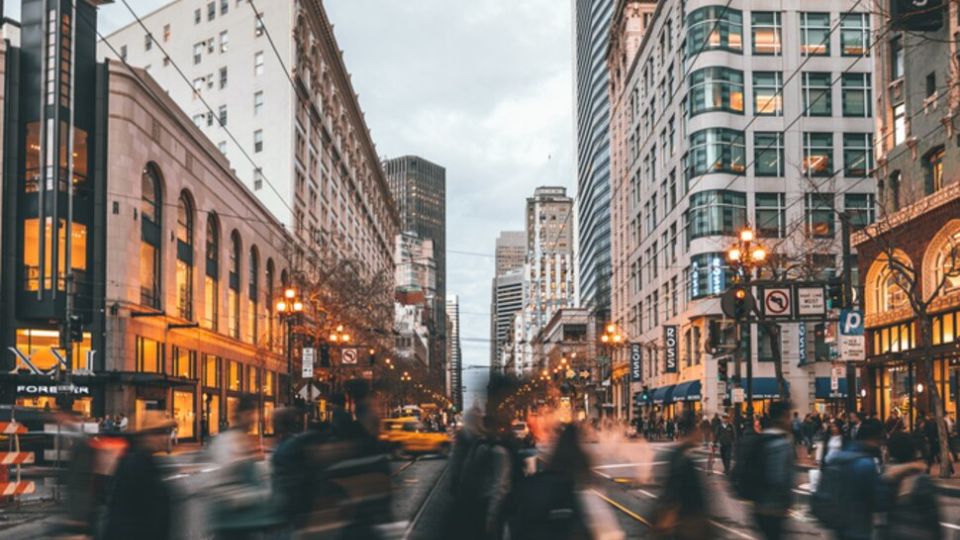
The United States is becoming more racially diverse, which is clearly seen in many of its cities. According to a U.S. News & World Report analysis, out of the 66 U.S. cities with a population of 300,000 or more in 2018, about 70% (46 cities) were more racially diverse in 2018 compared to 2010.
According to the Pew Research Center, 64% of Americans believe that racial and ethnic diversity has a positive impact on the country’s culture. Meanwhile, 47% of people think that having a racially and ethnically diverse population makes it more difficult for policymakers to address the country’s issues.
U.S. News measured how racially diverse U.S. cities are by looking at cities with a population of 300,000 or more within their legal boundaries. The U.S. Census Bureau’s 2018 American Community Survey provided population estimates for different racial and ethnic groups in the city. This information was used to determine the proportion of each group in the population and the likelihood of two randomly chosen people being from different racial and ethnic backgrounds. According to federal standards, people of Hispanic ethnicity can belong to any race. The analysis takes into account this overlap among different groups.
Most Racial Diversity US Cities
Stockton, California
Population: 311,189
Population Share:
- White: 49.6%
- Black: 12.7%
- American Indian or Alaska Native: 0.5%
- Asian: 23.6%
- Native Hawaiian or Pacific Islander: 0.7%
- Hispanic: 42.2%
Oakland, California
Population: 429,114
Population Share:
- White: 42.6%
- Black: 28.2%
- American Indian or Alaska Native: 1.1%
- Asian: 18.6%
- Native Hawaiian or Pacific Islander: 0.9%
- Hispanic: 26.5%
Sacramento, California
Population: 508,517
Population Share:
- White: 50.4%
- Black: 15.2%
- American Indian or Alaska Native: 0.6%
- Asian: 22.2%
- Native Hawaiian or Pacific Islander: 2.3%
- Hispanic: 29.2%
New York, New York
Population: 8,398,748
Population Share:
- White: 49.6%
- Black: 28.5%
- American Indian or Alaska Native: 0.5%
- Asian: 16.7%
- Native Hawaiian or Pacific Islander: 0.1%
- Hispanic: 29.2%
San Jose, California
Population: 1,030,119
Population Share:
- White: 46.8%
- Black: 3.5%
- American Indian or Alaska Native: 0.7%
- Asian: 41.9%
- Native Hawaiian and Pacific Islander: 0.6%
- Hispanic: 32.4%
Also Read: Avoid These Top Atlanta Suburbs to Visit in 2024
Houston, Texas
Population: 2,326,090
Population Share:
- White: 62.4%
- Black: 26.0%
- American Indian or Alaska Native: 0.4%
- Asian: 8.4%
- Native Hawaiian or Pacific Islander: 0.1%
- Hispanic: 44.9%
Los Angeles, California
Population: 3,990,469
Population Share:
- White: 67.0%
- Black: 11.2%
- American Indian or Alaska Native: 1.0%
- Asian: 15.6%
- Native Hawaiian or Pacific Islander: 0.2%
- Hispanic: 48.9%
Chicago, Illinois
Population: 2,705,988
Population Share:
- White: 56.6%
- Black: 32.5%
- American Indian or Alaska Native: 0.3%
- Asian: 7.4%
- Native Hawaiian or Pacific Islander: 0.02%
- Hispanic: 28.7%
Conclusion
The US is becoming more racially diverse, with 70% of cities with a population of 300,000 or more in 2018 being more diverse than in 2010. 64% of Americans believe racial and ethnic diversity positively impacts the country’s culture, while 47% find it difficult for policymakers to address issues. The most racially diverse US cities include Stockton, Oakland, Sacramento, New York, San Jose, Houston, Los Angeles, and Chicago.


Leave a Reply